The handover: Brazil is US$27 million away from becoming Argentine wine's #1 market
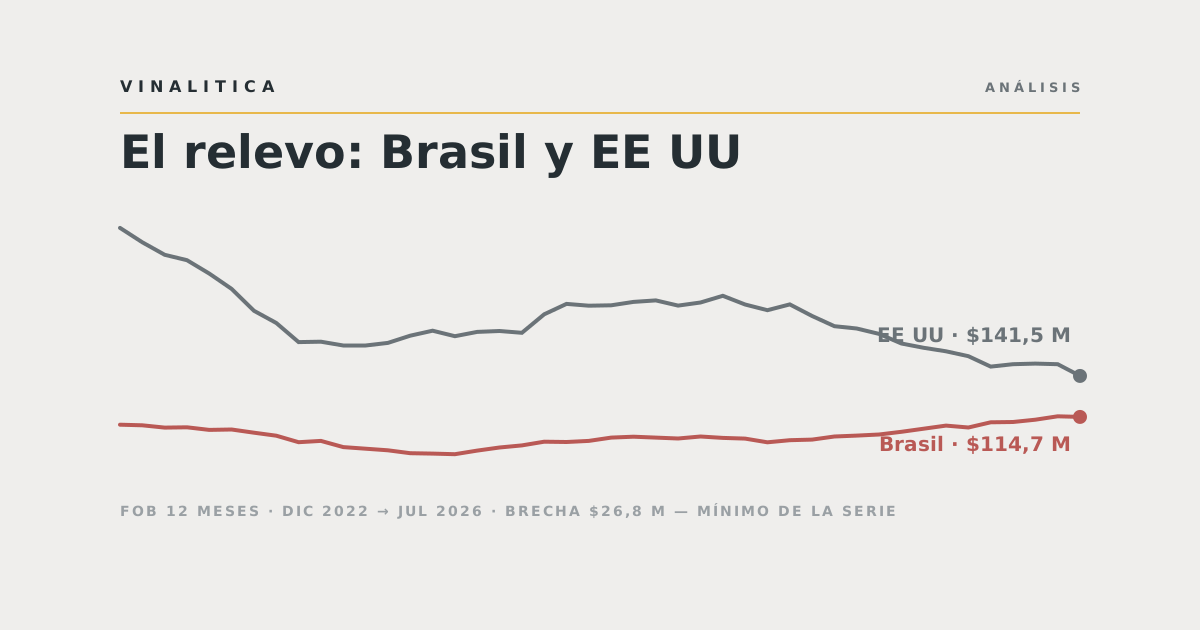
The 12-month gap between the US and Brazil stood at US$129M in late 2022. Today it is US$26.8M — the narrowest in our records. The crossover is no longer unthinkable, but the handover carries a cost, and crowns different winners.
July 2026 delivered a snapshot that would have seemed impossible two years ago: Brazil was the month's top destination, taking 23.4% of exported FOB, ahead of the United States. One month does not make a trend — but this time the month is not alone. The 12-month rolling series has been telling the same story for over a year: Argentine wine's historic #1 market keeps shrinking, its replacement keeps growing, and the distance between them is now the narrowest since our records began.
The two jaws
The gap didn't close by accident: the two curves have been working in opposite directions for two years. On the American side, the 12-month window fell from US$238M in late 2022 to US$141.5M today. There was a rebound — a local peak of US$193.9M in March 2025, just before the April 2025 US tariff announcements — followed by a steady −27% decline. On the Brazilian side, the trough came in March 2024 at US$90.3M. Since then, twenty-eight months of near-continuous growth to today's US$114.7M: +27%, without a single meaningful setback.
The result: a gap — always in 12-month cumulative FOB — of US$128.8M in December 2022, still US$92.9M in March 2025, and just US$26.8M at the close of July 2026 — the absolute minimum of the series. Over the last thirteen months the distance shrank by US$62M. We do not project crossovers: we show the speed. Readers can do their own math.
The same story, viewed month by month, adds a layer the rolling windows hide: seasonality. In the grid below, each cell is a month and the colour measures each side's share of the US + Brazil pair. Only four cells in the entire series cross 50% for Brazil: June 2024 (50.6%, the first ever), August 2025, June 2026 and July 2026 (56.7%, the record) — three of the four within the last twelve months. And the calendar matters: Brazilian peaks fall almost always between June and August, the southern winter, while December–February is, every year, the most American stretch of the series.
The handover is not neutral: every migrating dollar is worth less per litre
If Brazil ends up taking first place, Argentine wine will not merely have changed the flag on the podium — it will have changed businesses. Over the last 12 months the US paid an average of US$4.23 per litre; Brazil, US$3.50. The premium slice — shipments at 7 dollars per litre or more — accounts for 31% of FOB to the US versus 20.6% to Brazil. The rising market buys mostly Argentina's mid-range core; the declining one was also its high-price shop window.
That structural difference is the handover's fine print: replacing American dollars with Brazilian ones sustains volume but compresses the country's average price. It is not a reason to temper the celebration of Brazil — it is the reason the industry cannot afford to fully lose the American showcase.
A market that crowns different players
The other side of the handover is who wins on each field. Brazil is a less concentrated market than the US: over the last 12 months, the top five bodegas account for 26.6% of FOB there, versus 36.4% in the American market, with 376 Argentine bodegas active in that period. And the protagonists differ: in July, the top bodega in Brazil was Mosquita Muerta Wine (10.8% of the month), while Catena Zapata leads in the US (16.6%). For a mid-sized bodega, there is objectively more room to grow in São Paulo than in New York.
In thirteen months, the 12-month gap between Argentine wine's first and second markets went from US$90M to US$27M. The crossover is no longer a distant hypothesis: it is a distance the series measures month after month.Vinalitica analysis
What we will be watching
Three signals for the coming months. One: August in the US — the 10% tariff was settled on July 24; with uncertainty cleared, we will see whether American importers restart orders or whether the decline runs deeper than tariff noise. Two: whether Brazil holds 12-month windows above US$110M, something it had not managed since 2022. Three: price — whether Brazilian growth starts trading up (20.6% premium+ today) or consolidates as a volume market. The series is updated every month in our report.
Methodology: Argentine customs records processed by Vinalitica; 12-month rolling windows; series since December 2022. Both markets are measured with the same source and method (comparable basis; records are not exhaustive). July 2026 data is provisional. Per-litre averages are computed on declared FOB.